|
|
Spam E-mail captured over 75 days.png
|
|
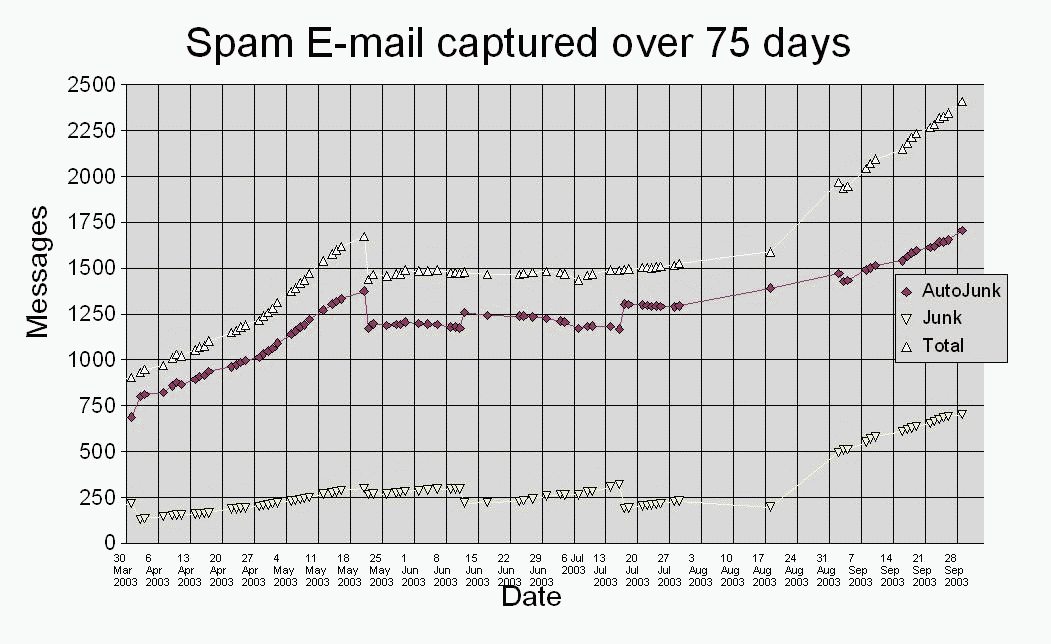
Shows the trend in the amount of junk mail saved
over a 75 day period. The top line is the total amount of spam, the
second line how much of that was trapped by some filtering rules I
created, and the bottom line shows the amount of spam I had to deal with
manually. Note the gaps in the samples while I was away on vacation
(August), and the adjustments I made in the filtering rules resulting in
an increase in the amount of spam caught by the rules (middle line jumps
up, bottom line jumps down. Also note the adjustment made in how I
collected the stats near the end of May.